Java Garbage Collection
Analyse GC
Enable GC
Pass following parameters to starting java process
-XX:+PrintGC -XX:+PrintGCDetails -XX:+PrintGCDateStamps -Xloggc:"$CARBON_HOME/repository/logs/gc.log" -XX:+UseGCLogFileRotation -XX:NumberOfGCLogFiles=100 -XX:GCLogFileSize=1024K
Analyse
Use GCViewer
git clone https://github.com/chewiebug/GCViewer
cd GCViewer
mvn clean install
java -jar ./target/gcviewer-1.36-SNAPSHOT.jar&  #run in a background
java -jar gcviewer-1.3x.jar gc.log.0;gc.log.1;gc.log.2;gc.log.current summary.csv [chart.png] [-t PLAIN|CSV|CSV_TS|SIMPLE|SUMMARY]
Recommended Throughput should be within 99% range.
Thread Dump
#!/bin/bash

# GIST: bsenduran/thread-analyze.sh
# https://gist.github.com/bsenduran/02e8bf024fcaaa7707a6bb2321e097a8

# If you get Permission Denied to connecto to process
# try to run just usr/lib/jvm/jdk-oracle/bin/jstack -F <javaPID>
# then rerun this script

# Other sources say you need to disable if you wish to use PTRACE()
# echo 0 > /proc/sys/kernel/yama/ptrace_scope #disables temporarly, default is "1"

# '-l' provides richer info, does not work on all OS, depends on Kernel config


if [ "$#" -ne 3 ]; then
        echo "usage: sh thread-analyze.sh <pid> <number-of-dumps> <interval>"
        echo "   eg: sudo ./thread-analyze.sh 1632 3 10s"
        echo "Avaialble units: s seconds, m for minutes, h for hours, d for days"
        exit
fi

count=$2
for i in `seq 1 $count`;
do
        /usr/lib/jvm/jdk-oracle/bin/jstack -F    $1 > thread_dump_`date "+%F-%T"`.txt &
#       /usr/lib/jvm/jdk-oracle/bin/jstack -F -l $1 > thread_dump_`date "+%F-%T"`.txt &
        ps --pid $1 -Lo pid,tid,%cpu,time,nlwp,c > thread_usage_`date "+%F-%T"`.txt &
if [ $i -ne $count ]; then
        echo "sleeping for $3 [$i]"
        sleep $3
fi
done
Usage
sudo -u <user-of-PID> ./thread-analyze.sh <PID> <iterations> <delay-in-secons>s
sudo -u <user-of-PID> ./thread-analyze.sh 1632 5 10s
JMX - Java Management Extensions
Connecting to the remote JVM is a two step process:
- First, the client will connect to the RMI registry to download the RMI stub for the JMXConnectorServer; this RMI stub contains the IP address and port to connect to the RMI server, i.e. the remote JMXConnectorServer.
- Second, the client uses the RMI stub to connect to the RMI server (i.e. the remote JMXConnectorServer) typically on an address and port that may be different from the RMI registry address and port.
The configuration for the RMI registry and the RMI server is specified by a JMXServiceURL. The string format of an RMI JMXServiceURL is:
service:jmx:rmi://<rmi_server_host>:<rmi_server_port>/jndi/rmi://<rmi_registry_host>:<rmi_registry_port>/jmxrmi
The RMI (Remote Method Invocation) is an API that provides a mechanism to create distributed application in java. The RMI allows an object to invoke methods on an object running in another JVM.
The RMI provides remote communication between the applications using two objects stub and skeleton.
References:
Jsonsole
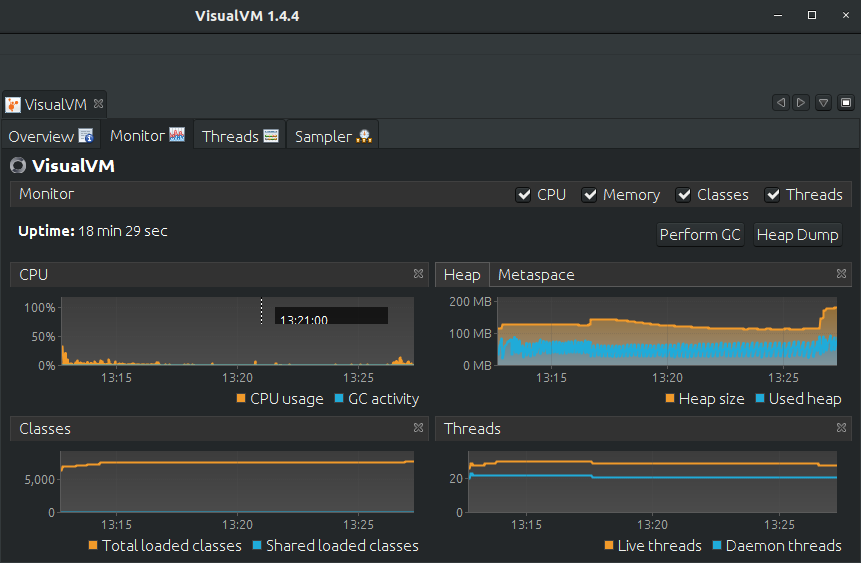
VisualVM
Modern replacement for Jconsole.
Collect heapdump
# get PID, remember ps -ef, where -f shows full command
  PID TTY          TIME CMD
12631 ?        6-15:47:42 java
# the following command should be run as a user of the process
locate jmap # locate jmap location and if not in $PATH use full-path in the command below
sudo -u <processID-user> jmap -dump:file=heap_dump.bin <process_Id>
sudo -u <processID-user> jmap -dump:file=$(hostname)-<env>-$(date +"%Y%m%dT%H%M")-heap_dump.bin <process_Id>
Memory allocation
Java recommends heap of 25% of full memory for a container. It's 1/64 for initial and 1/4 for MAX.
Monitor Java
Java does expose mBeans as it's metrics. This is part of JMX implementation.
Jolokia
In short, it exposes mBeans / JMX protocol over HTTP Rest api.
Jolokia is a JMX-HTTP bridge giving an alternative to JSR-160 connectors. It is an agent based approach with support for many platforms. In addition to basic JMX operations it enhances JMX remoting with unique features like bulk requests and fine grained security policies.
ssh to wso2@server
wget https://search.maven.org/remotecontent?filepath=org/jolokia/jolokia-osgi/1.6.2/jolokia-osgi-1.6.2.jar -O jolokia-osgi-1.6.2.jar
chown wso2:wso2 jolokia-osgi-1.6.2.jar
sudo cp jolokia-osgi-1.6.2.jar <PRODUCT-HOME>/repository/components/dropins # dir where jar's are loaded into runtime
sudo systemctl restart wso2.service ; tail -f <PRODUCT-HOME>/repository/logs/wso2carbon.log
# OOB deployment is not user/password secured
curl https://localhost:9443/jolokia/version -k | jq # use port 9763 for http (noSSL)
{
  "request": {
    "type": "version"
  },
  "value": {
    "agent": "1.6.2",
    "protocol": "7.2",
    "config": {
      "listenForHttpService": "true",
      "authIgnoreCerts": "false",
      "agentId": "10.0.10.1-4018-52d95d2c-osgi",
      "debug": "false",
      "agentType": "servlet",
      "policyLocation": "classpath:/jolokia-access.xml",
      "agentContext": "/jolokia",
      "serializeException": "false",
      "mimeType": "text/plain",
      "dispatcherClasses": "org.jolokia.http.Jsr160ProxyNotEnabledByDefaultAnymoreDispatcher",
      "authMode": "basic",
      "authMatch": "any",
      "streaming": "true",
      "canonicalNaming": "true",
      "historyMaxEntries": "10",
      "allowErrorDetails": "true",
      "allowDnsReverseLookup": "true",
      "realm": "jolokia",
      "includeStackTrace": "true",
      "useRestrictorService": "false",
      "debugMaxEntries": "100"
    },
    "info": {
      "product": "equinox",
      "vendor": "Eclipse",
      "version": "3.9.1.v20130814-1242"
    }
  },
  "timestamp": 1574350467,
  "status": 200
}
Other endpoints
http://localhost:9763/jolokia/list # list all MBeans
http://localhost:9763/jolokia/read/org.apache.synapse:Name=https-sender,Type=PassThroughConnections/ActiveConnections # WSO2 ESB MBean
http://localhost:9763/jolokia/read/java.lang:type=Memory/HeapMemoryUsage # Reading Heap Memory
- References
- Monitoring JVM in Kubernetes in this example WSO2 application
- JMX Monitoring using Jolokia
- Carbon JMX Monitoring using Jolokia]
hawt.io
Hawtio consists of 2 parts: an AngularJS applicaton and a Java backend, which proxies the communication between the frontend and Jolokia endpoints. The frontend has access to all JMX attributes and operations available in Java applications running locally and remotely.
