Difference between revisions of "Linux monitor resources from terminal"
Jump to navigation
Jump to search
| Line 130: | Line 130: | ||
10.0.20.197 net 106 46.1 195.60.0.1 82 32.2 | 10.0.20.197 net 106 46.1 195.60.0.1 82 32.2 | ||
10.0.20.197 uk 8 3.5 | 10.0.20.197 uk 8 3.5 | ||
.. | |||
2nd level Query Names TopLevelDomain - queries | 2nd level Query Names TopLevelDomain - queries | ||
| Line 142: | Line 139: | ||
adobe.com 1 7.7d? . 1 1.9 | adobe.com 1 7.7d? . 1 1.9 | ||
twitter.com 1 7.7 uk 1 1.9 | twitter.com 1 7.7 uk 1 1.9 | ||
.. | |||
Key shortcuts | |||
s - Sources list t - Query types r - Rcodes ^R - Reset counters | s - Sources list t - Query types r - Rcodes ^R - Reset counters | ||
d - Destinations list o - Opcodes ^X - Exit | d - Destinations list o - Opcodes ^X - Exit | ||
Revision as of 21:12, 15 May 2016
Resources
mtr - My Traceroute
Combines ping and traceroute into interactive tool. It's often already included in the most of distributions.
Usage:
$ mtr wp.pl
Key bindings:
- d - to switch Display modes:
- tracert+ping,
- Cisco lost packets
- Latency
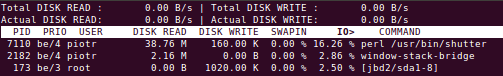
iotop
$sudo iotop -aoP
- -a Will show accumulated output
- -o Will only output
- -P Will only show processes instead of threads

sysstat
sudo apt-get install sysstat
$ sar
09:25:01 AM     CPU     %user     %nice   %system   %iowait    %steal     %idle
09:35:01 AM     all      0.11      0.00      0.01      0.00      0.00     99.88
09:45:01 AM     all      0.12      0.00      0.01      0.00      0.00     99.86
The %iowait is the time spent waiting on I/O. Using the Debian package, you must enable the stat collector via the /etc/default/sysstat config file after package installation. To see current utilization broken out by device, you can use the iostat
$sudo iostat -x 1
Linux 3.13.0-43-generic (piotr-x220) 	21/05/15 	_x86_64_	(4 CPU)

avg-cpu:  %user   %nice %system %iowait  %steal   %idle
           4.37    0.03   17.66    3.68    0.00   74.26

Device:         rrqm/s   wrqm/s     r/s     w/s    rkB/s    wkB/s avgrq-sz avgqu-sz   await r_await w_await  svctm  %util
sda               8.23    39.52   78.63   45.53  3546.76  4702.75   132.88     6.22   50.06    9.87  119.45   3.09  38.37
dstat
$ sudo apt-get install dstat
$ dstat -tdD total,sda,sdb,sdc,md1 60        #colourful
----system---- -dsk/total----dsk/sda--
     time     | read  writ: read  writ
21-05 22:13:04|3441k 4478k:3441k 4478k
21-05 22:13:18| 109k  242k: 109k  242k
21-05 22:13:29|  62k 1404k:  62k 1404k
21-05 22:13:34|  81k 1263k:  81k 1263k
- -t for timestamps
- -d for disk statistics
- -D to specify the exact devices to report
- 60 to average over 60 seconds. The display is updated every second, but only once per 60 seconds a new line will be started.
- -c can report wait IO percentage, which in most cases is related to the CPU waiting for data from the disks
Saidar
sudo apt-get install saidar
Hostname  : linux-ubuntu  Uptime : 00:14:52          Date : 2015-01-25 11:56:42

Load 1    :   0.19   CPU Idle  :  96.01%  Running   :     2   Zombie    :     0
Load 5    :   0.27   CPU System:   1.12%  Sleeping  :   198   Total     :   200
Load 15   :   0.22   CPU User  :   2.87%  Stopped   :     0   No. Users :     2

Mem Total :   3729M  Swap Total:   3869M  Mem Used  : 22.04%  Paging in :     0
Mem Used  :    822M  Swap Used :      0B  Swap Used :  0.00%  Paging out:     0
Mem Free  :   2907M  Swap Free :   3869M  Total Used: 10.82%

Disk Name      Read         Write         Network Interface        rx        tx
ram0             0B            0B         eth0                     0B        0B
ram1             0B            0B         lo                       0B        0B
ram2             0B            0B         wlan0                  373B       84B
ram3             0B            0B
ram4             0B            0B         Mount Point            Free      Used
ram5             0B            0B         /                      245G     10.59%
ram6             0B            0B         /sys                     0B      -nan%
ram7             0B            0B         /proc                    0B      -nan%
ram8             0B            0B         /dev                  1854M      0.00%
ram9             0B            0B         /dev/pts                 0B      -nan%
ram10            0B            0B         /run                   371M      0.34%
ram11            0B            0B         /                      245G     10.59%
Network
netstat - network statistics
In CentOS 7 net-tools package has been replaced by iproute2 therefore in course to use netstat needs installing:
[piotr@vmcent7 ~]$ sudo yum install net-tools

[piotr@vmcent7 ~]$ sudo netstat -pant
Active Internet connections (servers and established)
Proto Recv-Q Send-Q Local Address           Foreign Address         State       PID/Program name
tcp        0      0 127.0.0.1:25            0.0.0.0:*               LISTEN      1771/master
tcp        0      0 0.0.0.0:22              0.0.0.0:*               LISTEN      1434/sshd
tcp        0      0 192.168.1.148:22        192.168.1.89:40653      ESTABLISHED 35910/sshd: piotr [
tcp        0      0 192.168.1.148:22        192.168.1.89:40614      ESTABLISHED 35831/sshd: piotr [
tcp        0      0 192.168.1.148:22        192.168.1.64:4334       ESTABLISHED 35679/sshd: piotr [
tcp6       0      0 ::1:25                  :::*                    LISTEN      1771/master
tcp6       0      0 :::22                   :::*                    LISTEN      1434/sshd
ss - socket viewer
ss tool is by defult shipped in a minimal CentOS 7, similar to the netstat provides more detailed information about sockets.
[piotr@vmcent7 ~]$ sudo ss -pant
State       Recv-Q Send-Q             Local Address:Port          Peer Address:Port
LISTEN      0      100                    127.0.0.1:25                       *:*      users:(("master",1771,13))
LISTEN      0      128                            *:22                       *:*      users:(("sshd",1434,3))
ESTAB       0      0                  192.168.1.148:22            192.168.1.89:40653  users:(("sshd",35914,3),("sshd",35910,3))
ESTAB       0      0                  192.168.1.148:22            192.168.1.89:40614  users:(("sshd",35835,3),("sshd",35831,3))
ESTAB       0      0                  192.168.1.148:22            192.168.1.64:4334   users:(("sshd",35683,3),("sshd",35679,3))
LISTEN      0      100                          ::1:25                      :::*      users:(("master",1771,14))
LISTEN      0      128                           :::22                      :::*      users:(("sshd",1434,4))
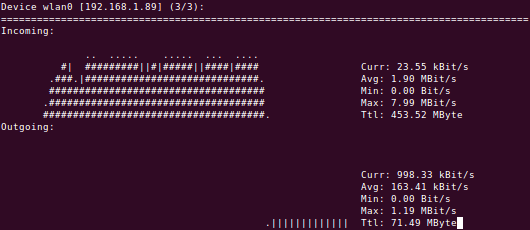
nload - network load
nload #use left right arrow to switch view between interfaces

dnstop - domain queries stats
./dnstop eth0 #download http://dnstop.measurement-factory.com
Available statistics can be toggled using key shortcuts
Query Type     Count      %
---------- --------- ------
A?               202   97.1
NS?                4    1.9
SRV?               1    0.5
AAAA?              1    0.5

Source      Query Name     Count      %        Destinations     Count      %
----------- ---------- --------- ------        ------------ --------- ------
10.0.20.197 com              106   46.1        195.60.0.5         173   67.8
10.0.20.197 net              106   46.1        195.60.0.1          82   32.2
10.0.20.197 uk                 8    3.5
..

2nd level Query Names                        TopLevelDomain - queries
Query Name           Count      %            Query Name     Count      %
---------------- --------- ------            ---------- --------- ------
akamaiedge.net           5   38.5            net               38   73.1
akamai.net               3   23.1            com               12   23.1
adobe.com                1    7.7d?          .                  1    1.9
twitter.com              1    7.7            uk                 1    1.9
..
Key shortcuts
 s - Sources list        t - Query types    r - Rcodes  ^R - Reset counters
 d - Destinations list   o - Opcodes                    ^X - Exit
 1 - 1st level Query Names      ! - with Sources
 2 - 2nd level Query Names      @ - with Sources
 3 - 3rd level Query Names      # - with Sources
 4 - 4th level Query Names      $ - with Sources
 5 - 5th level Query Names      % - with Sources
 6 - 6th level Query Names      ^ - with Sources
 7 - 7th level Query Names      & - with Sources
 8 - 8th level Query Names      * - with Sources
 9 - 9th level Query Names      ( - with Sources
List of resource monitoring tools
- Performance and resources monitors
- htop
- lsof
- iotop
- vmstat -S m #displays stats in Mb
- Network monitoring tools
- bmon
- bwbar
- bwm
- bwm-ng
- iftraf
- iftop
- iperf
- ipfm
- speedometer
- cbm
- ibmonitor
- pktstat
- mactrack
- nload -u K wlan0
- vnstat -d -i wlan0
- trace 198.6.1.2
- traceroute
- tracepath
- tracepath6
- mtr 198.6.1.2
- Hardware
- lspci
- inxi -v4 -F -xxADGMN
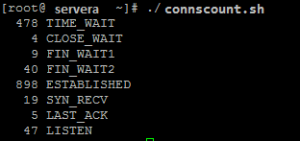
Network statistics scripts
connscount.sh
#!/bin/bash
 netstat -an | awk '/^tcp/ {A[$(NF)]++} END {for (I in A) {printf "%5d %s\n", A[I], I}}'

dnscheck.pl
#!/usr/bin/perl -w
use strict;
while () {
my $date = localtime(time());
        open(CH,"dig \@195.60.0.1 www.bbc.co.uk |") || die "cannot run dig: $!\n";
        while (<CH>) {
                chomp;
                next unless /query time/i;
                print $date . "$_\n";
        };
        close CH;
        open(CH,"dig \@195.60.0.5 www.bbc.co.uk |") || die "cannot run dig: $!\n";
        while (<CH>) {
                chomp;
                next unless /query time/i;
                print $date . "$_\n";
        };
        close CH;

        sleep 10;
};
Run ./dnscheck.pl
Fri Dec 11 21:50:15 2015;; Query time: 5 msec
Fri Dec 11 21:50:15 2015;; Query time: 4 msec
Service control managers
- Ubuntu: System > Administrator > services
- bum - GUI bootup manager
- rcconf
- sysv-rc-conft